Reporting Dashboard
As a marketer or business owner, one of the most important things we can do for our business is use data to help us make decisions. This is especially true when it comes to websites and digital marketing. The capability to capture data is there, you just have to set it up properly.
Luckily, Google has given us lots of tools to use to measure our website activities. Google Analytics, Google Tag Manager, Google Search Console, and Google Data Studio are all FREE tools that allow us to collect data and display it in a beautiful, easy-to-understand way.
If you’re using WordPress, but not taking advantage of these tools, this package is for you. I’ll connect your site to the data collection software (Analytics, Tag Manager, and Search Console), then create a report in Dat Studio that is emailed to you monthly.
You can use this report to help make decisions about what steps to take next on your website (read more below about that).
How does business intelligence help decision-making?
Business intelligence includes all aspects of using data to drive your business’s decision-making. It’s easy to get caught up in biases you have due to the day-to-day running of your business. Using data means you have numbers to back up (or guide) your opinions.
The tools I mentioned above are a great way to start gathering, reporting, and analyzing your online marketing activities. We just have to set them up. Once we do, you’ll have a custom dashboard that tells you exactly what you need to know.
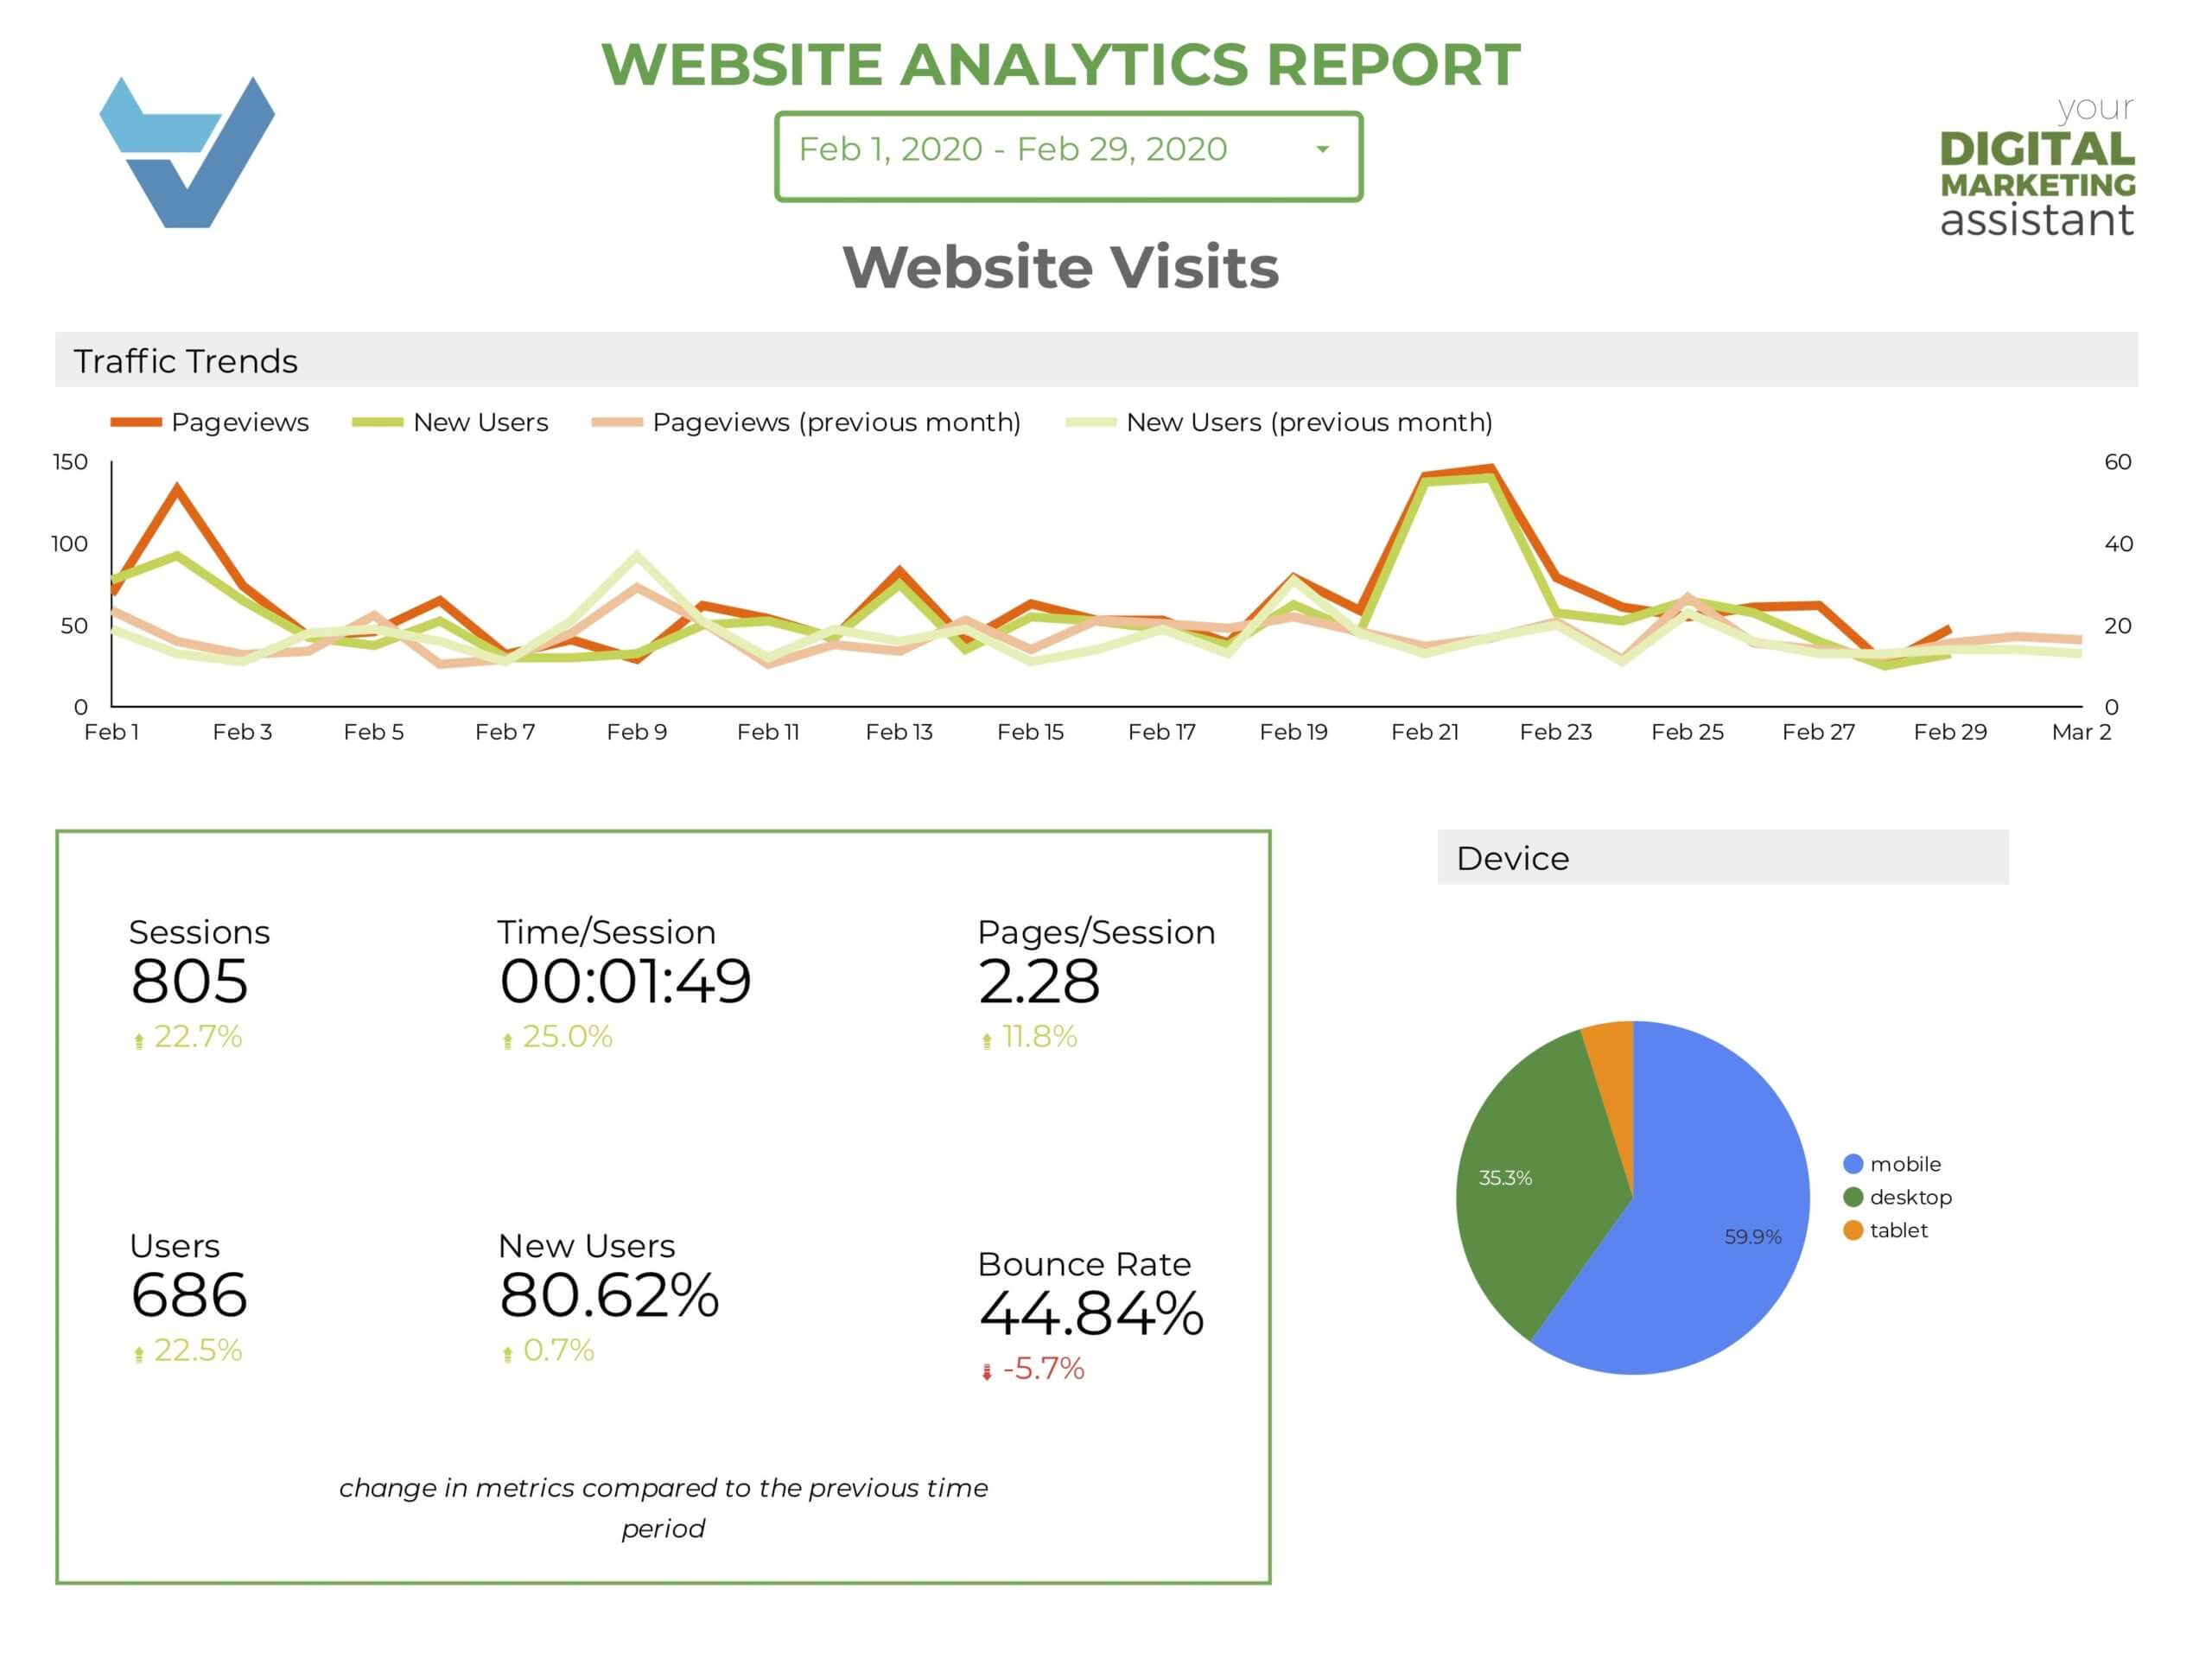
Number of Visitors
Your site visitor numbers let you know how many people are finding you, gathering information, and qualifying your business for a future purchase. By comparing visits to leads or calls, you can tell if your website is doing what it's supposed to.
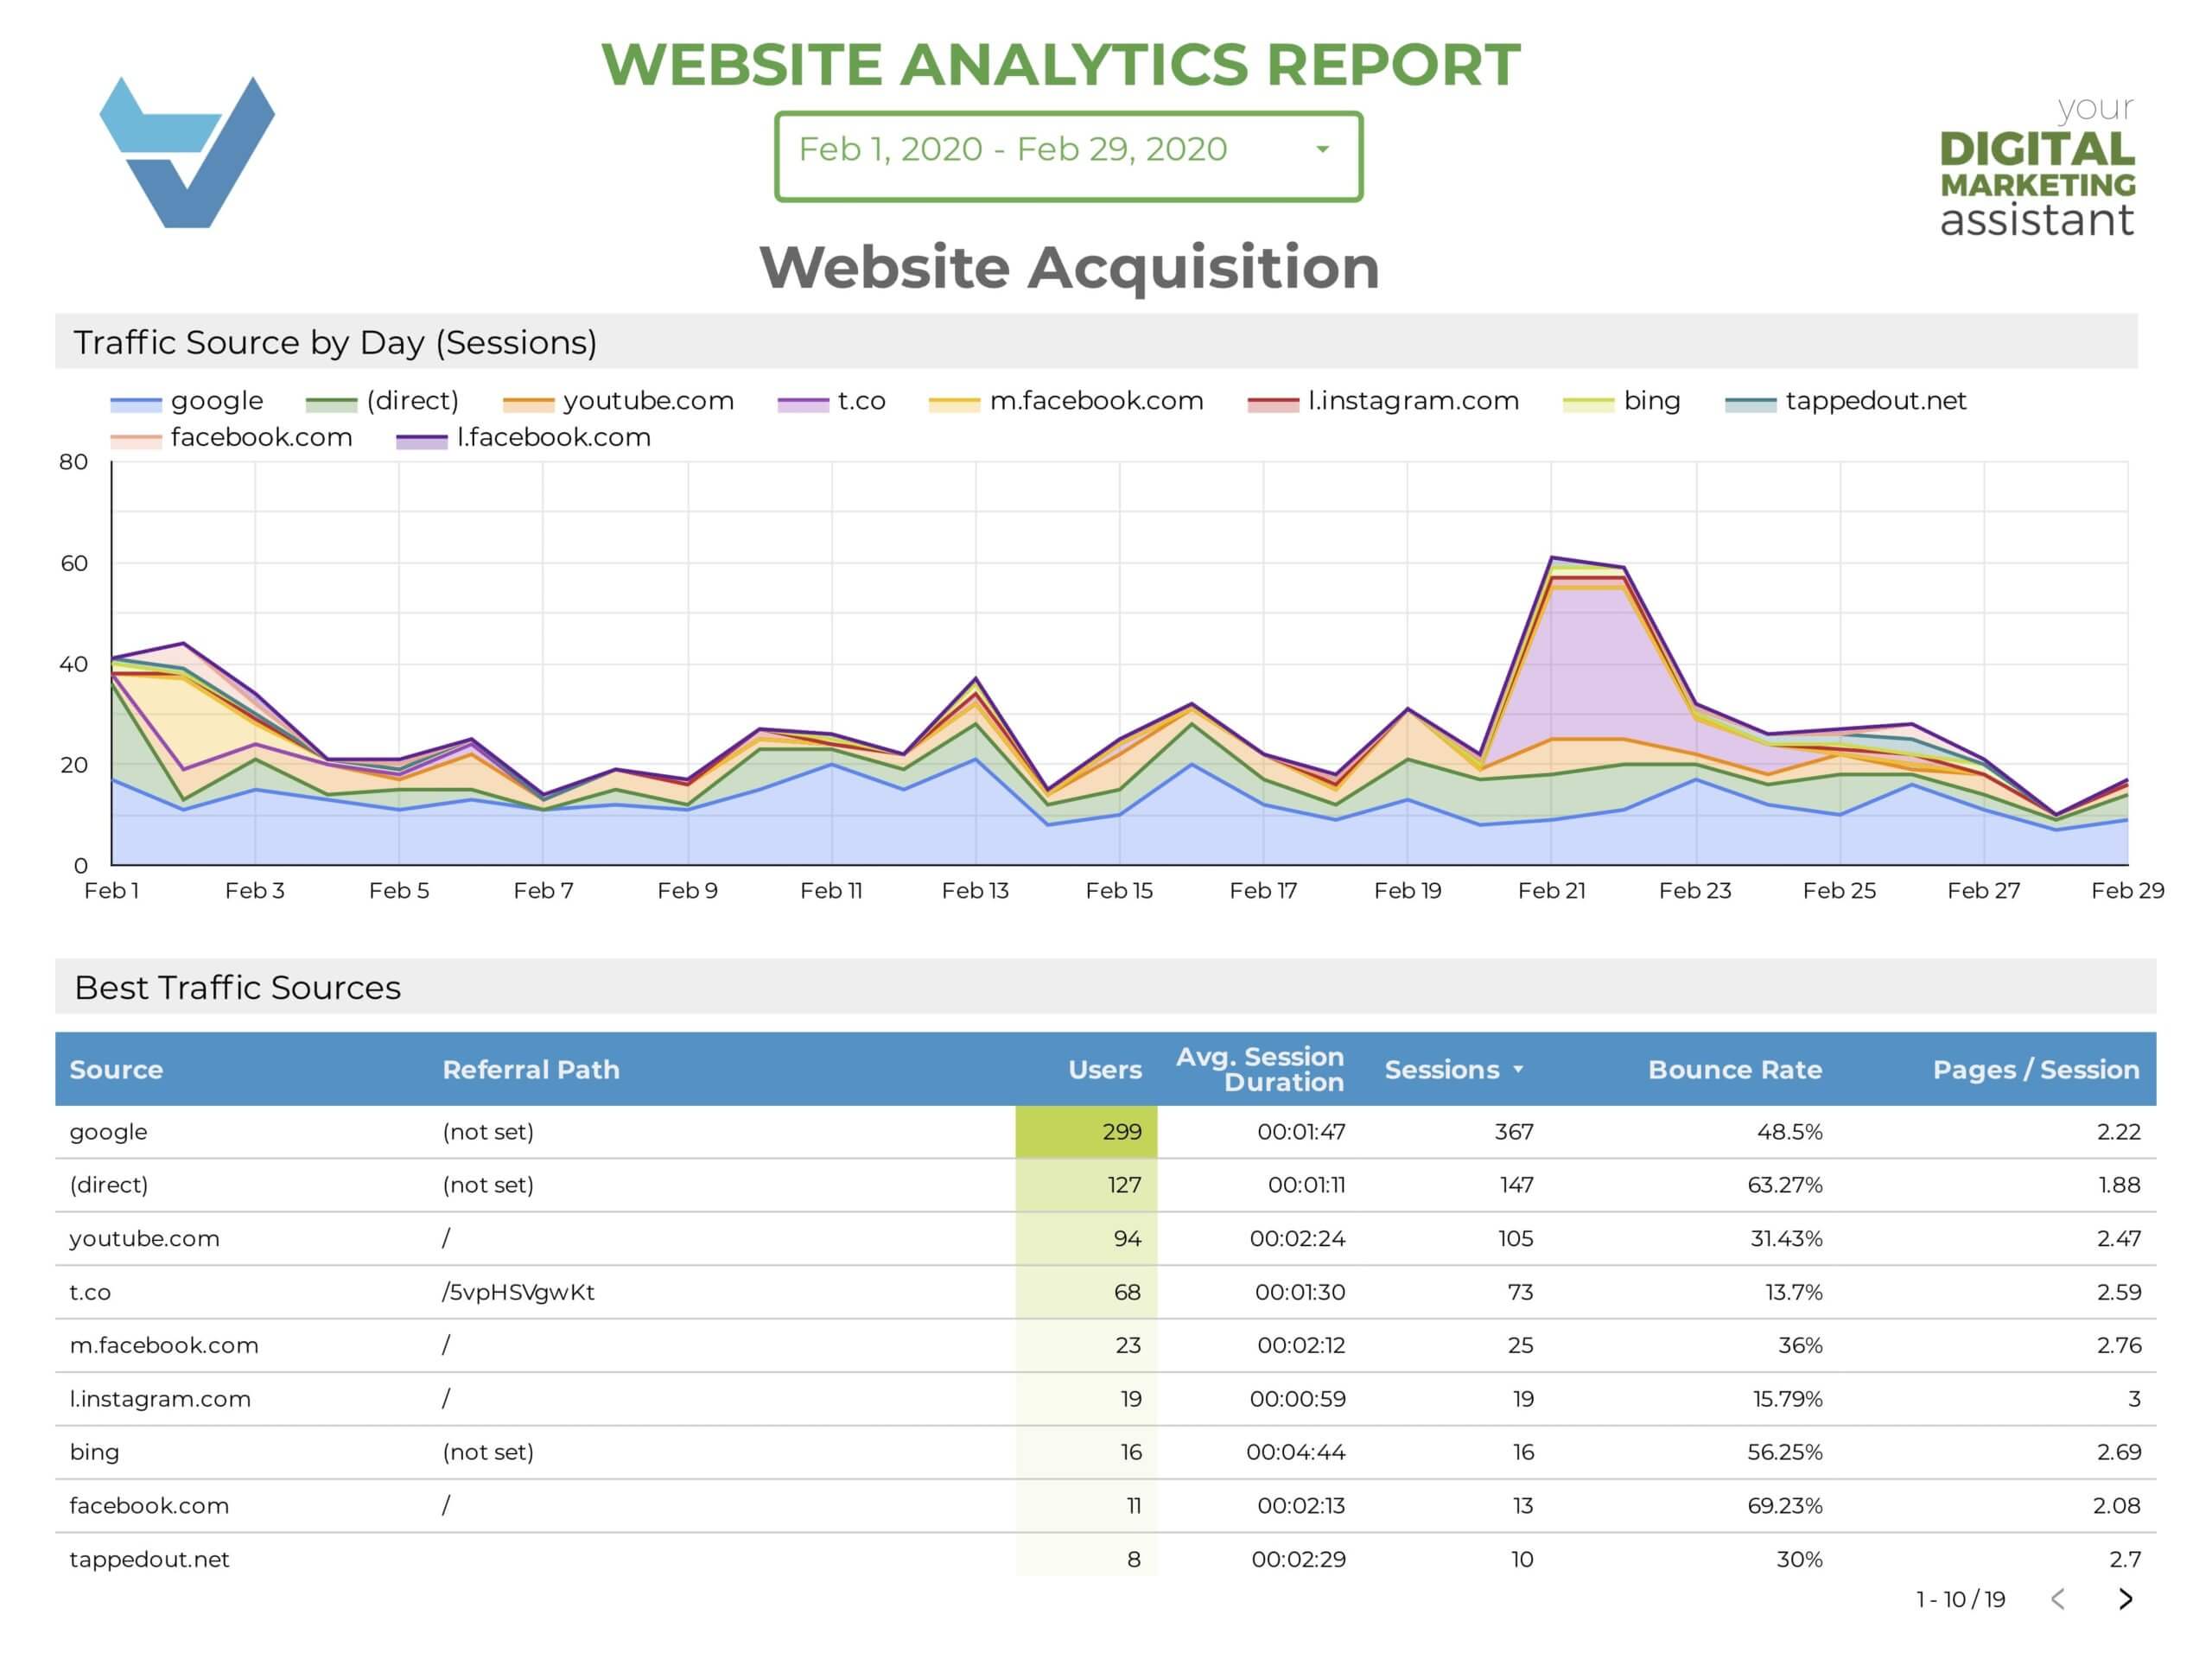
Acquisition
How do users find your site? Analyzing visits from social media, search results, links from other websites, and email campaigns, and more, tells you what channels you need to work on and if your past efforts were on point.
Goals
Every website has goals, from awareness, and education, to leads and purchases. Analytics lets you assign dollar amounts to goals so you can easily calculate ROI or cost-per-conversion.
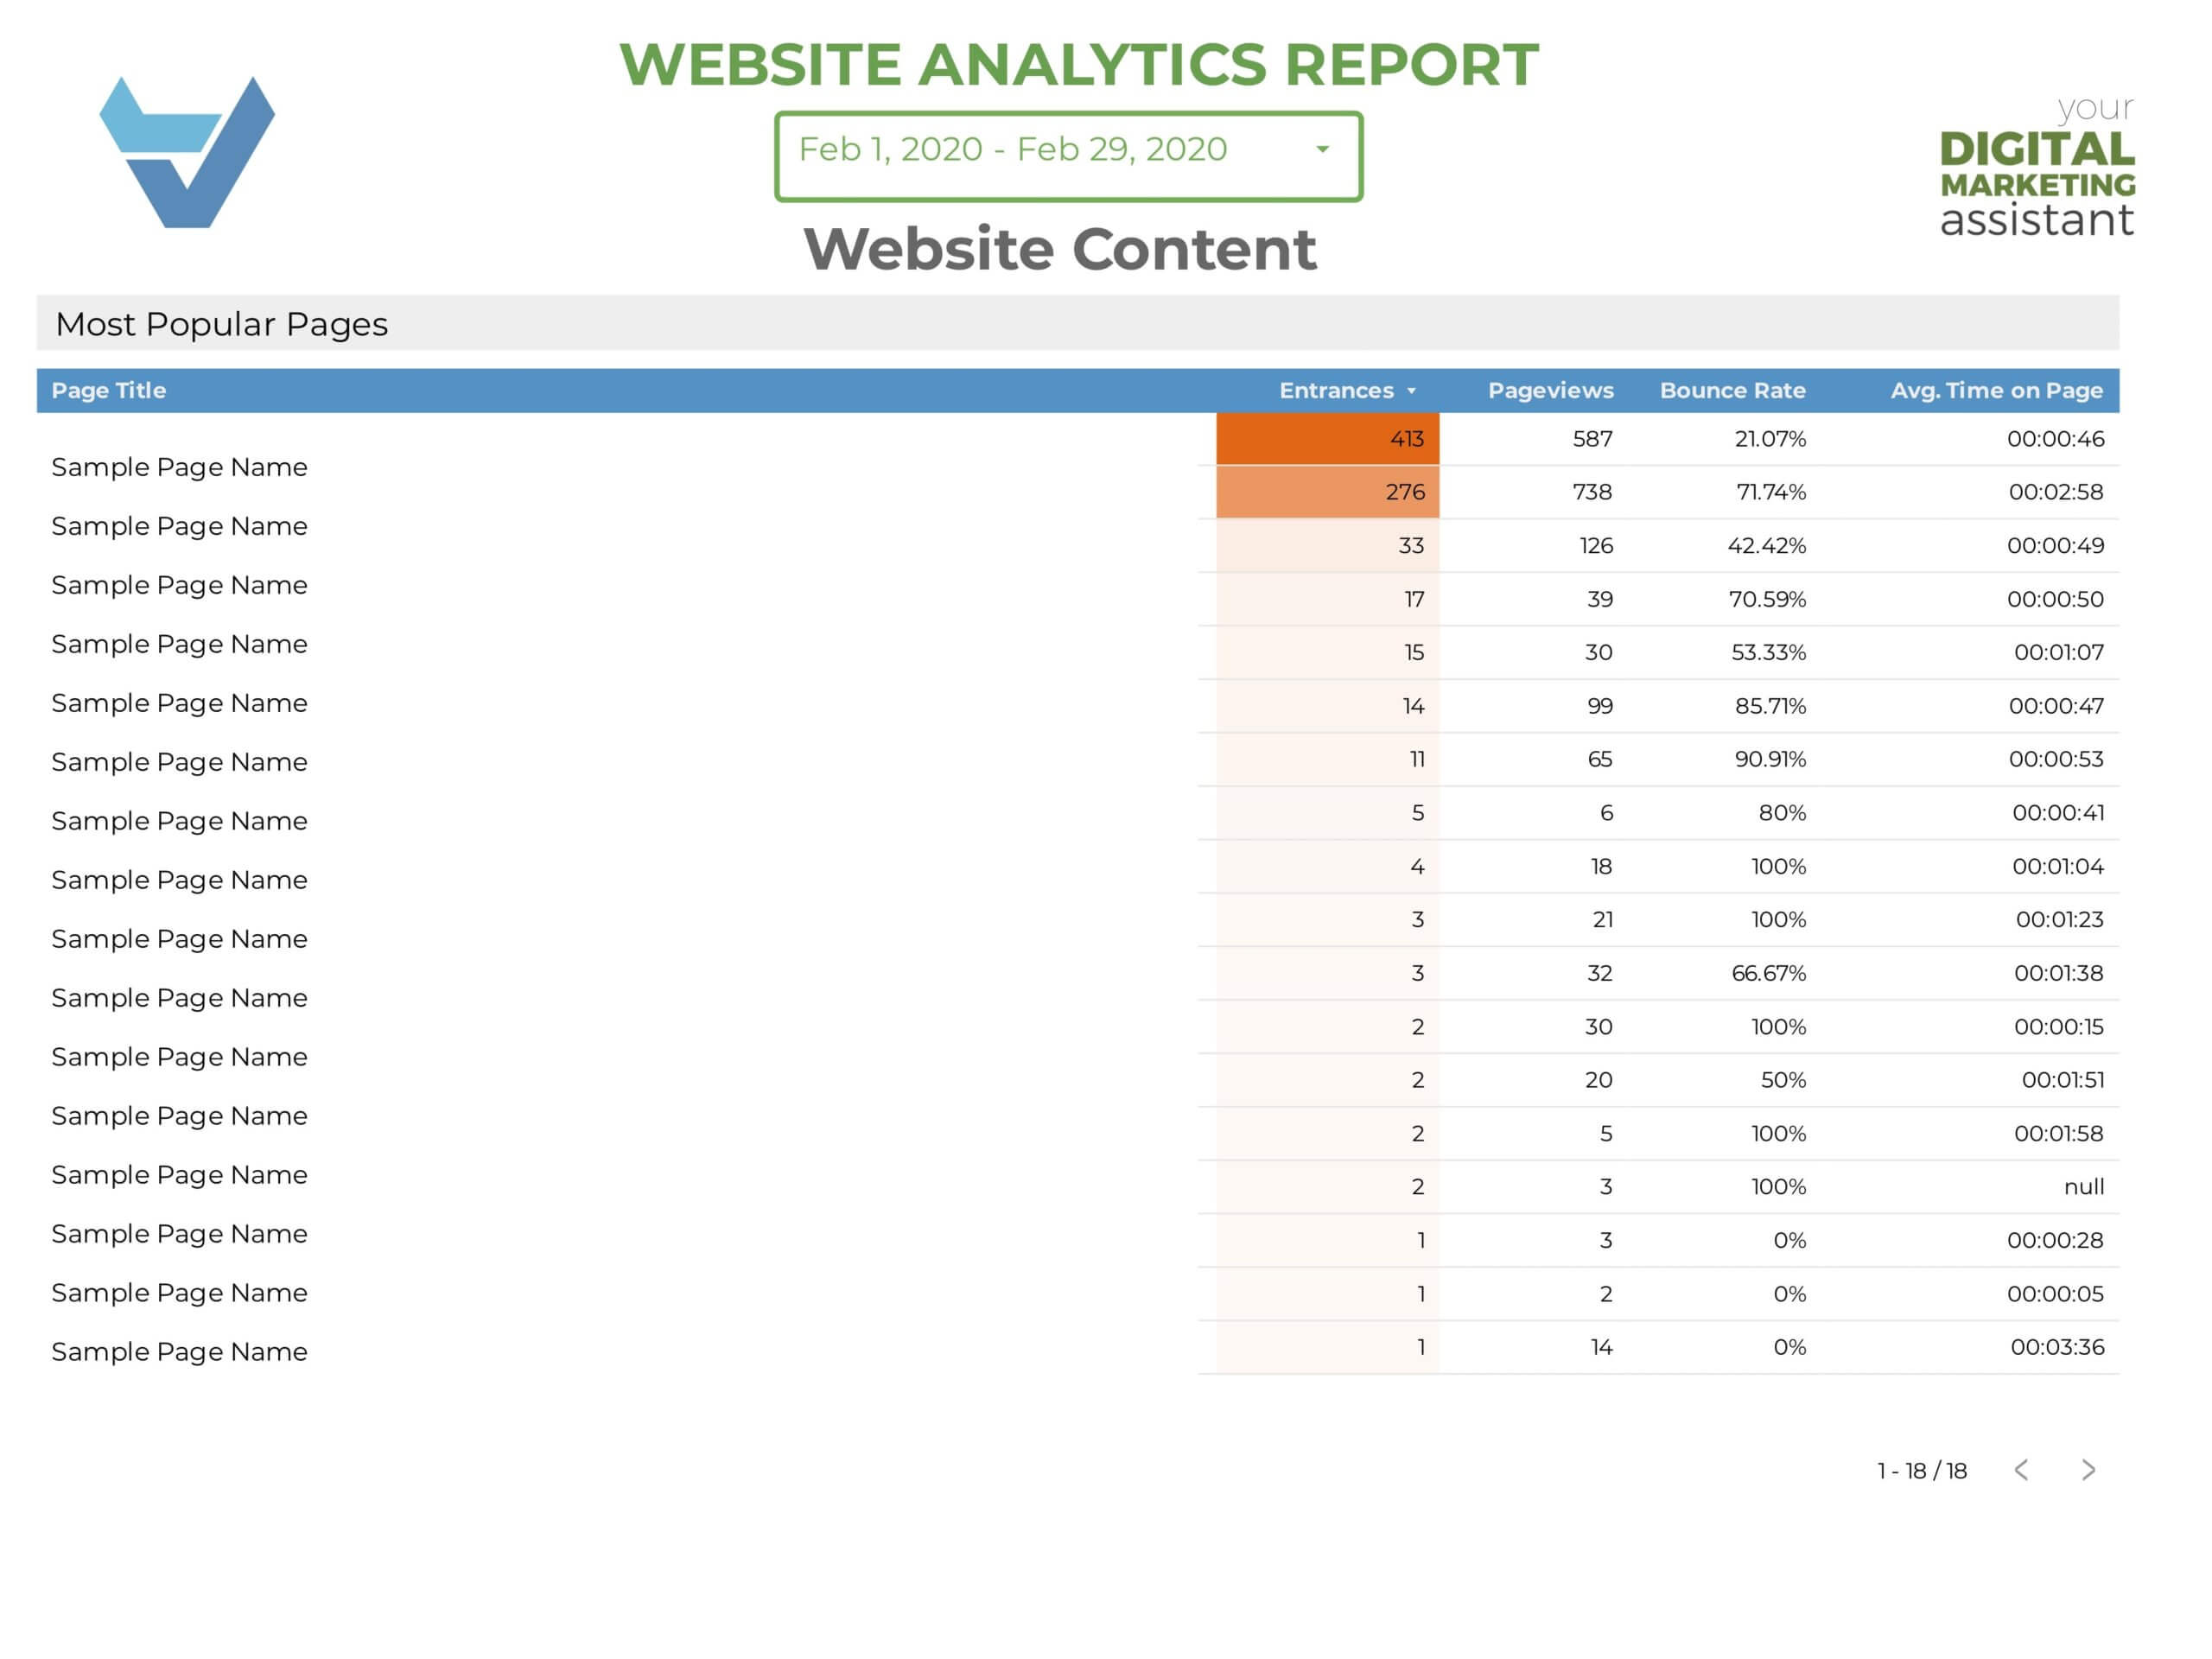
Landing Pages
See which sites are bringing in users, or leading to conversions. If a page is doing well, maybe it's time to add other resources on that topic. If it's not (and it's supposed to) it's time to ramp up SEO on that page.
Time On Page
Users who stay awhile are getting value from your website, and Google measures this! The longer your time-on-page, and the lower your bounce rate, the more traffic Google will send your way.
Clicks
Want to see how many people click on your offer, but don't convert? Google Tag Manager lets you see stats like this. Maybe your form is too long (or broken!), but by looking at drop offs you see where you need to improve.
These are just some examples of ways you can improve your website and digital presence through business intelligence. There are so many more that are specific to your industry and workflow. I customize your report so you can measure exactly what you need to.
What does a Reporting Dashboard Look Like?
1 Page Campaign Report
If you’re running ads on different channels, you probably want an easy way to view your efforts on a daily basis, without having to log into each platform.
This one-page campaign report gives you an overview of how your campaign is doing so you can spend more on ads, or spend more time improving content or targeting.
You tell me what you want to measure, and I’ll set it up.

Comprehensive Website Report
Viewing your WordPress website report on at least a monthly basis gives great insight into your daily performance online.
This report is multiple pages and includes insights into your audience, acquisition, search performance and so much more.
Have specifics you need tracked? No problem. I can also add filters so you can drill down by device type, demographic, or language.
Custom Platform Report
If you have a multi-channel online presence, you’ll want to measure your efficacy across all of them. If your channel has a way to export data, I’ll pull it into a report that shows you exactly what you want to see.
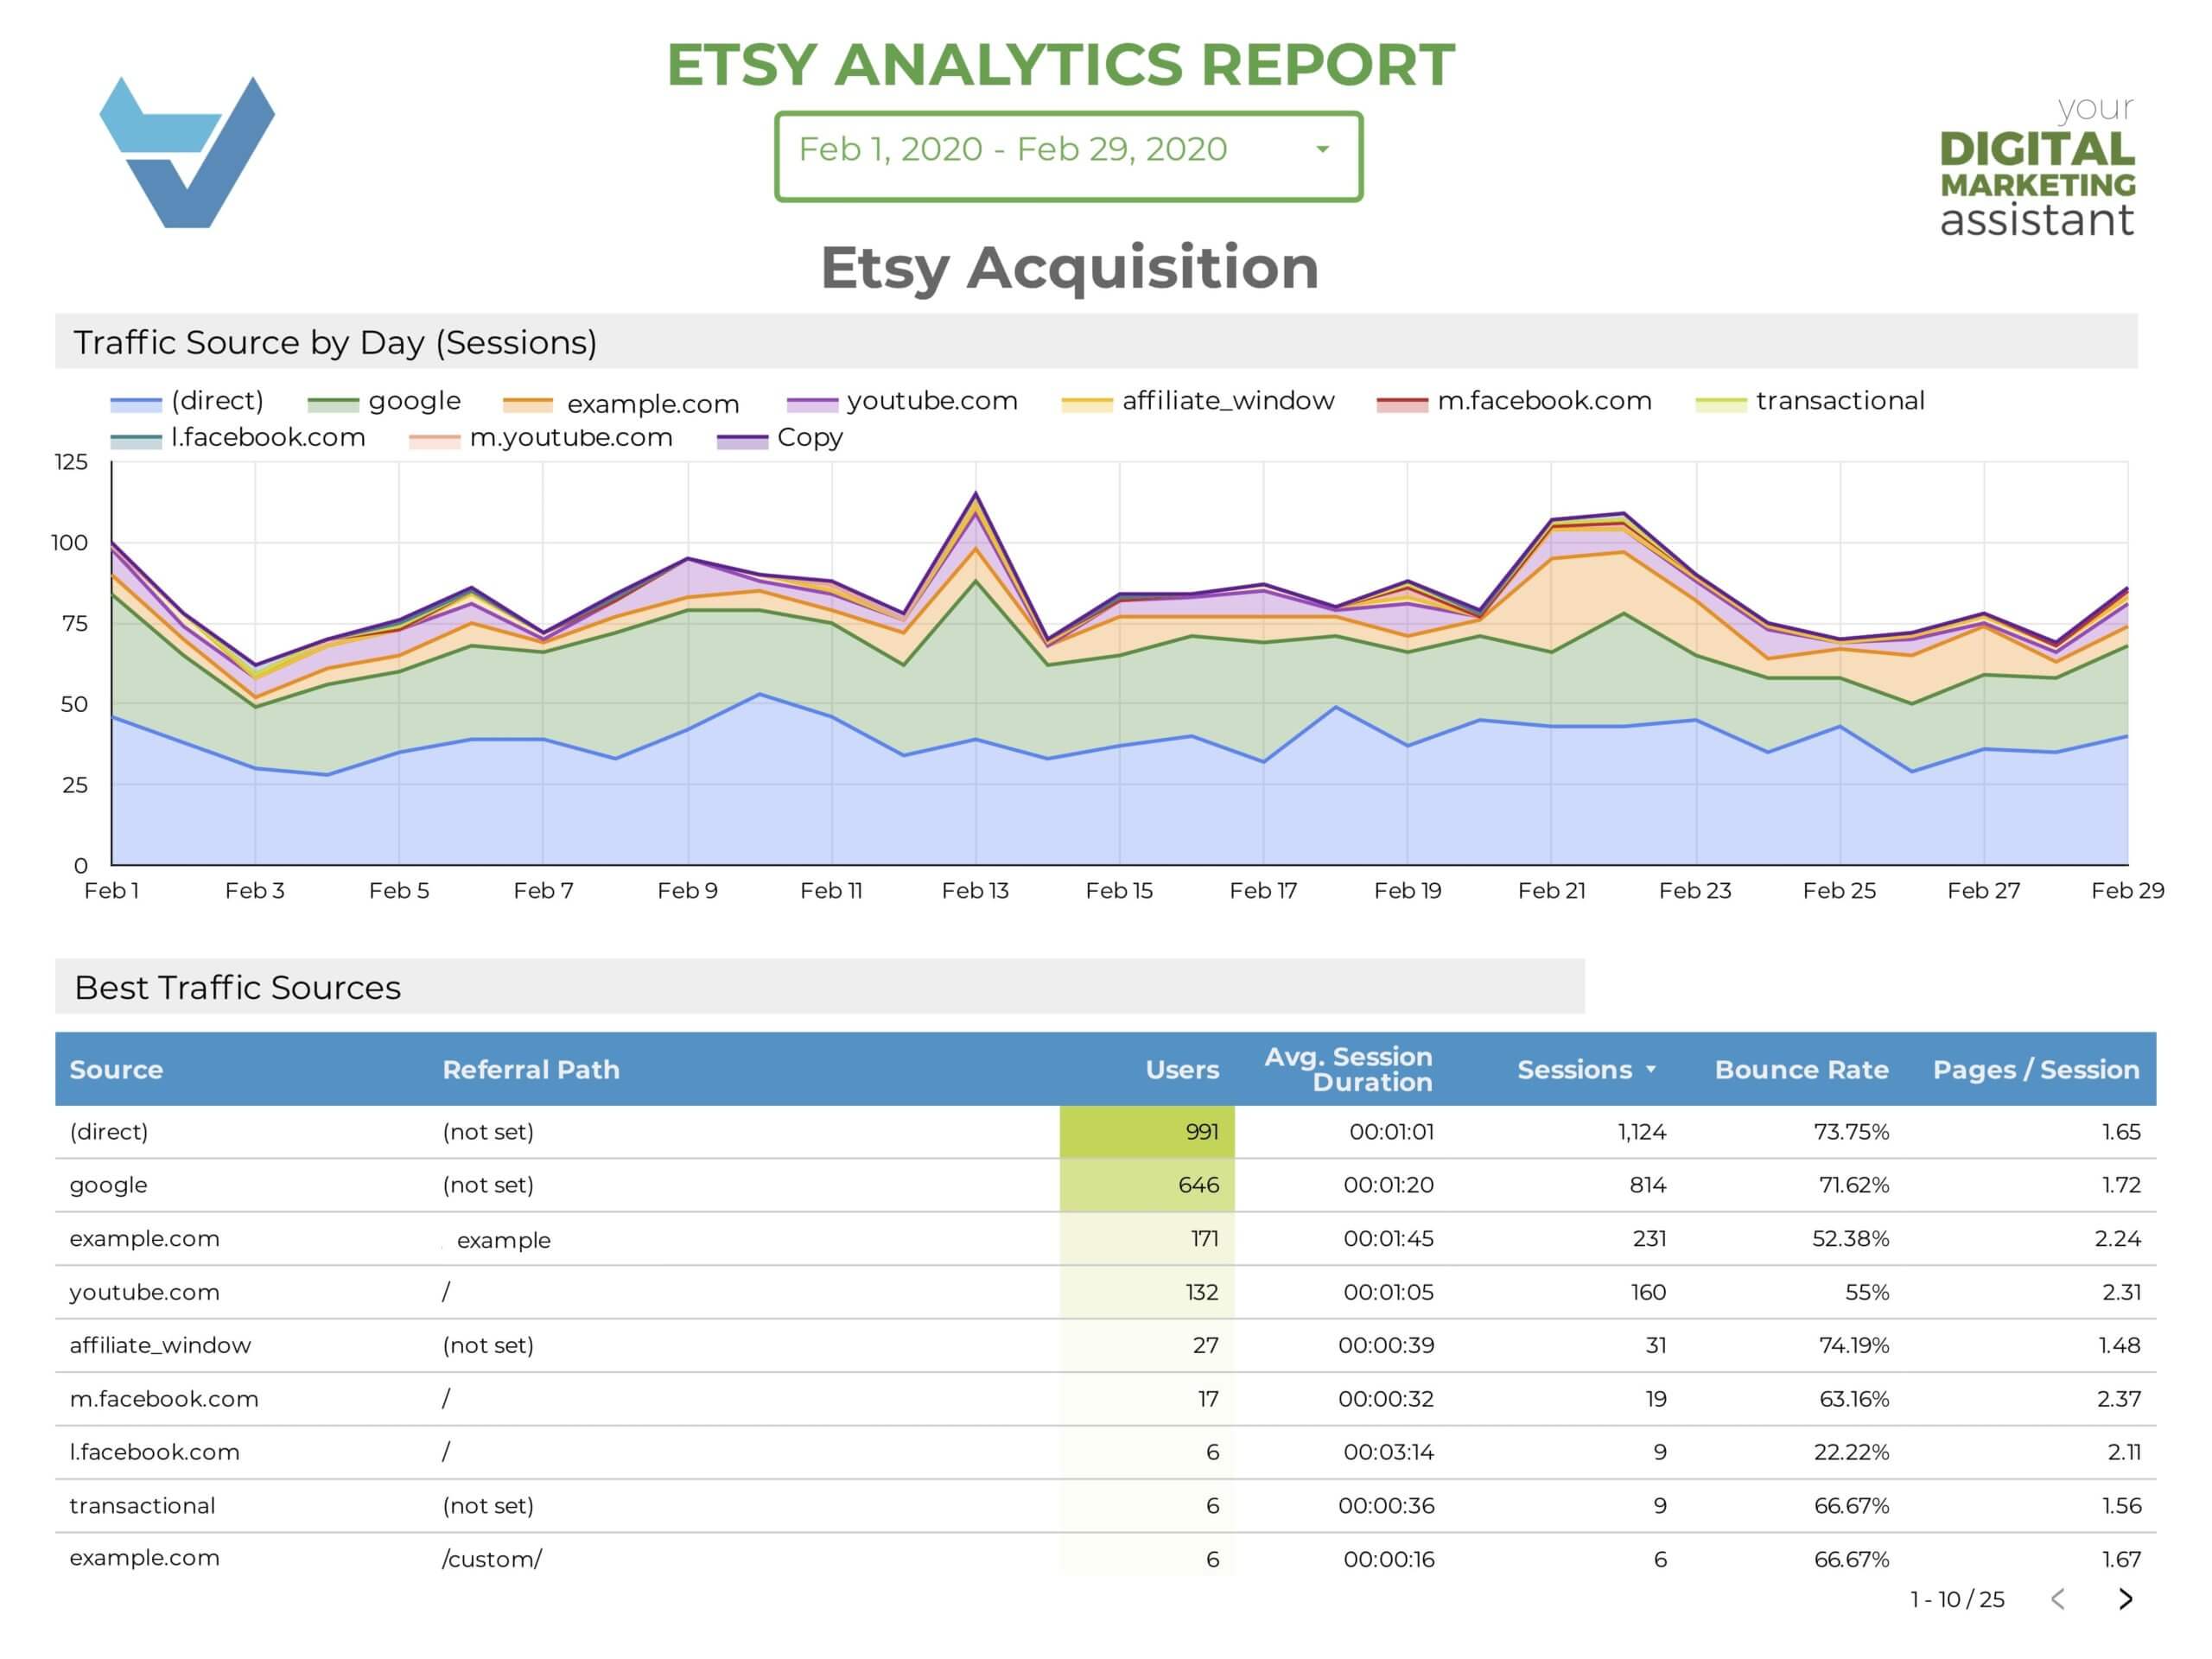
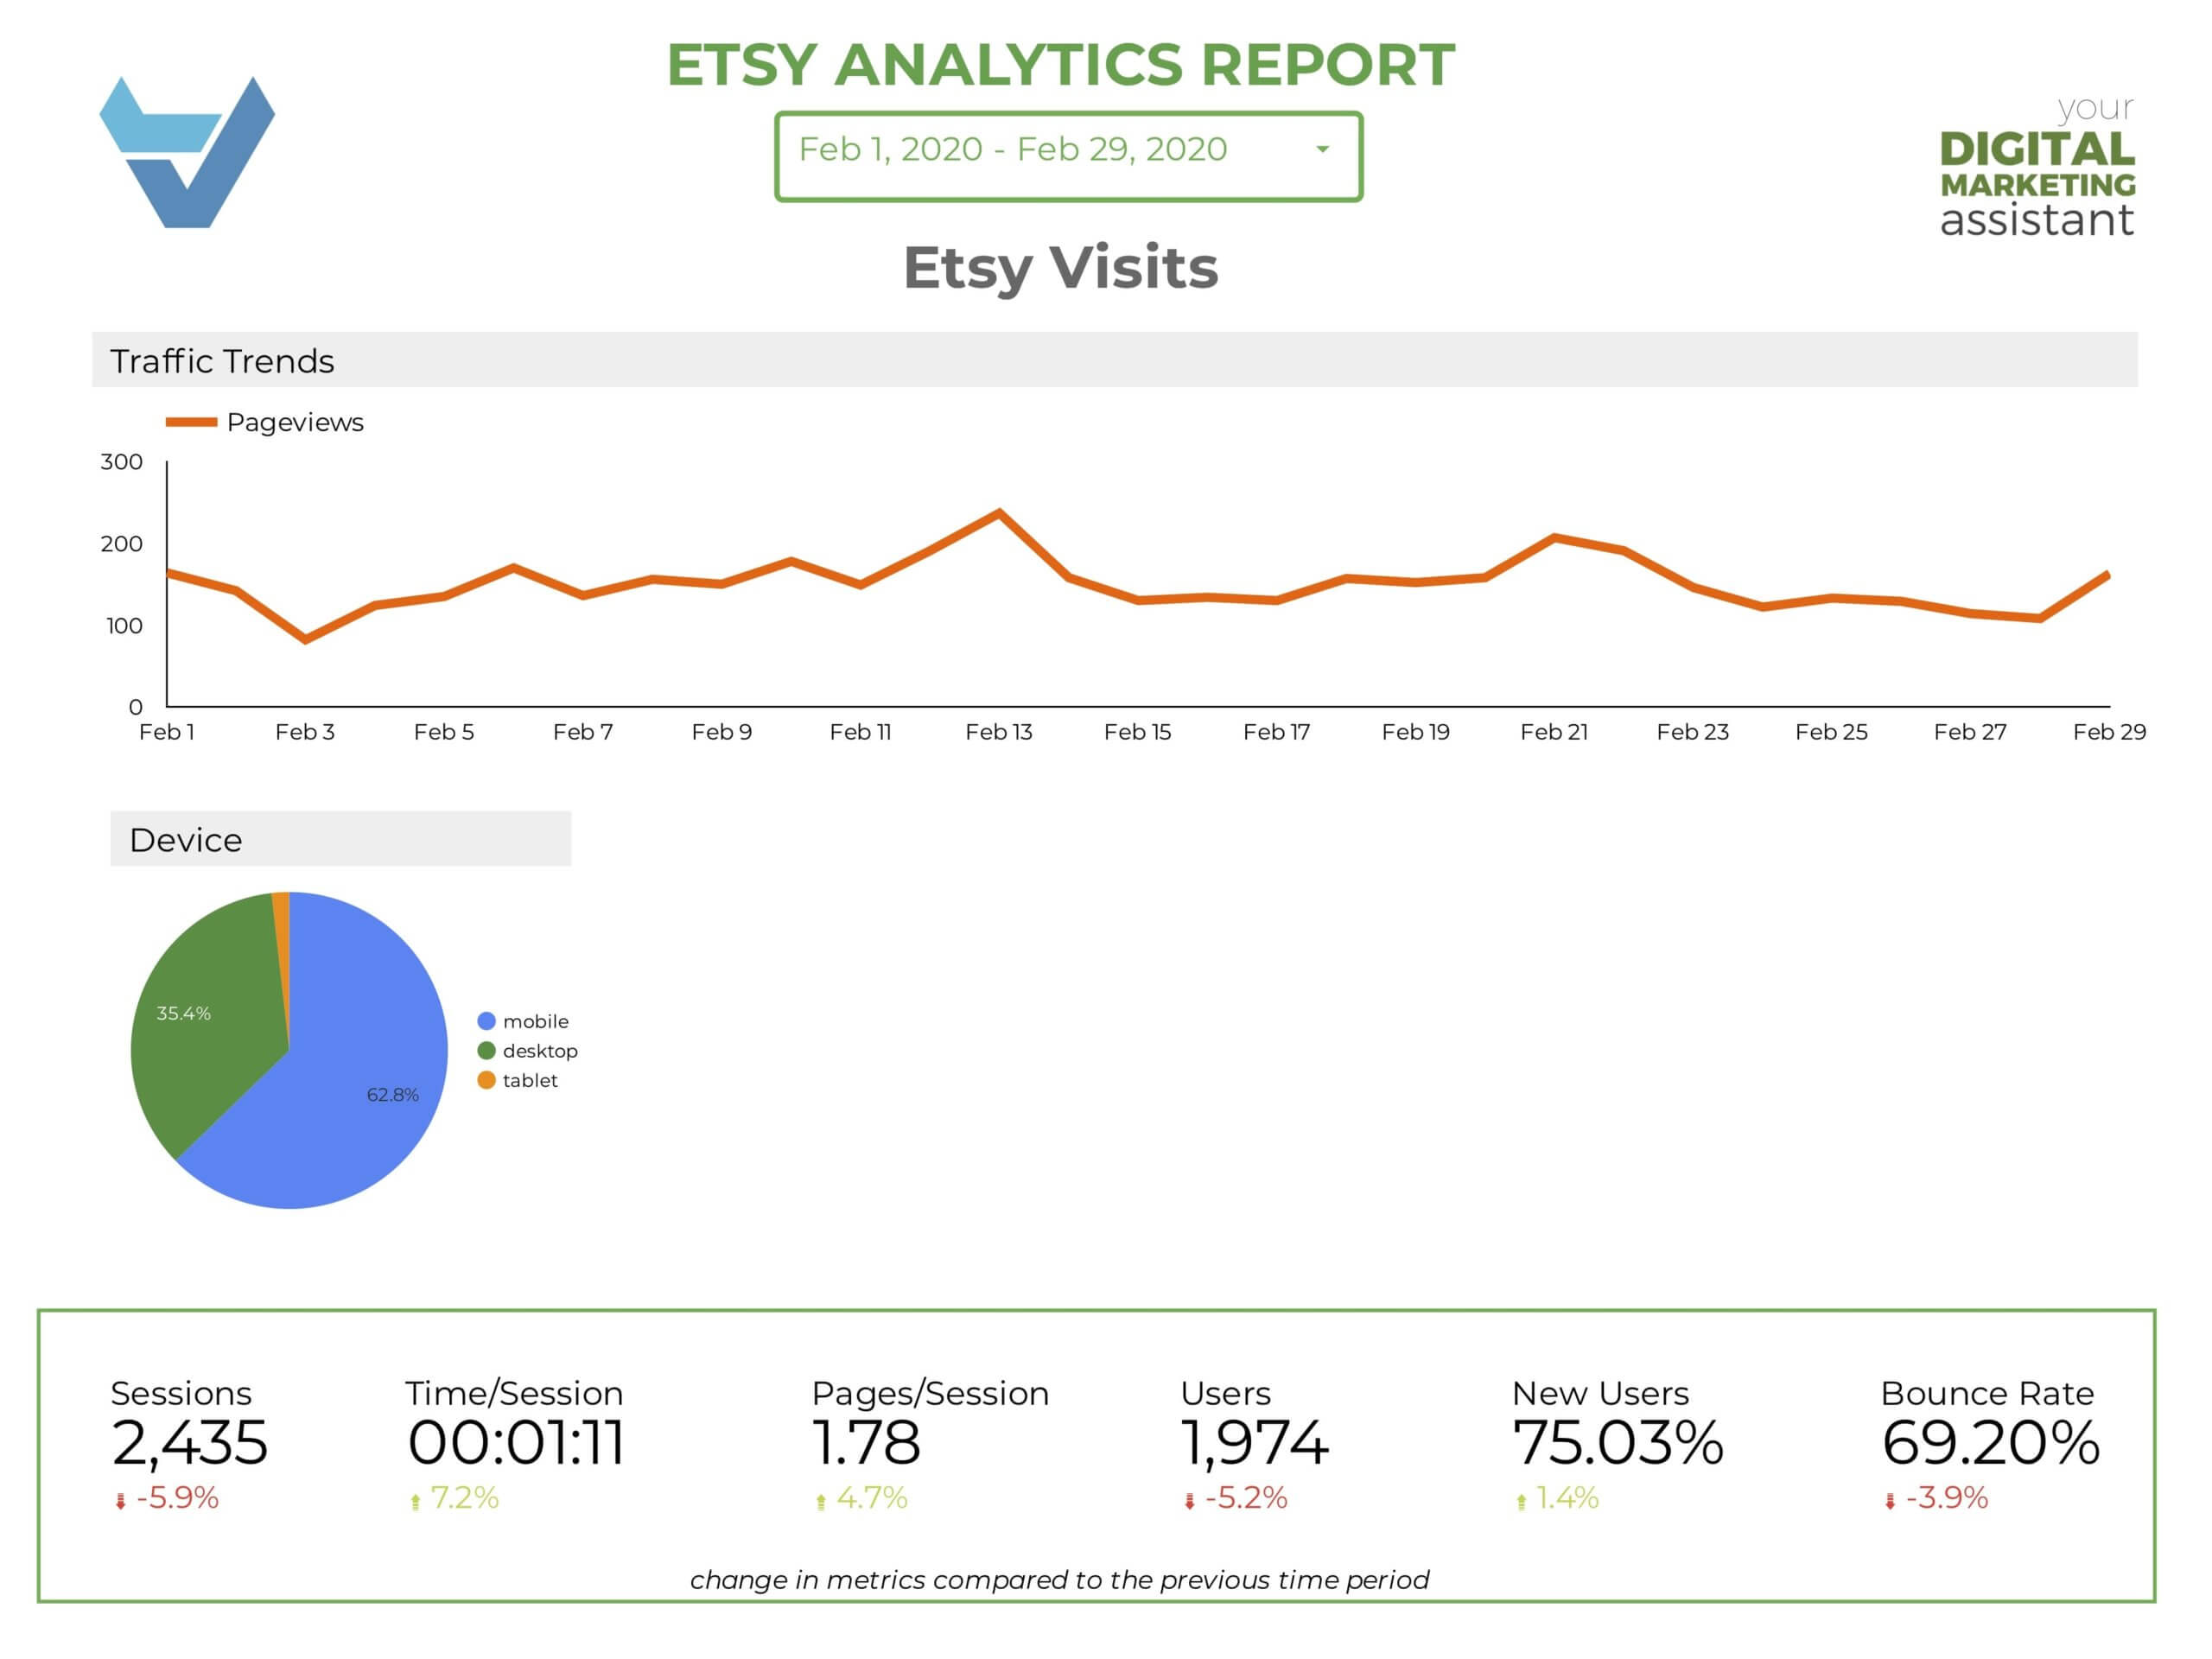
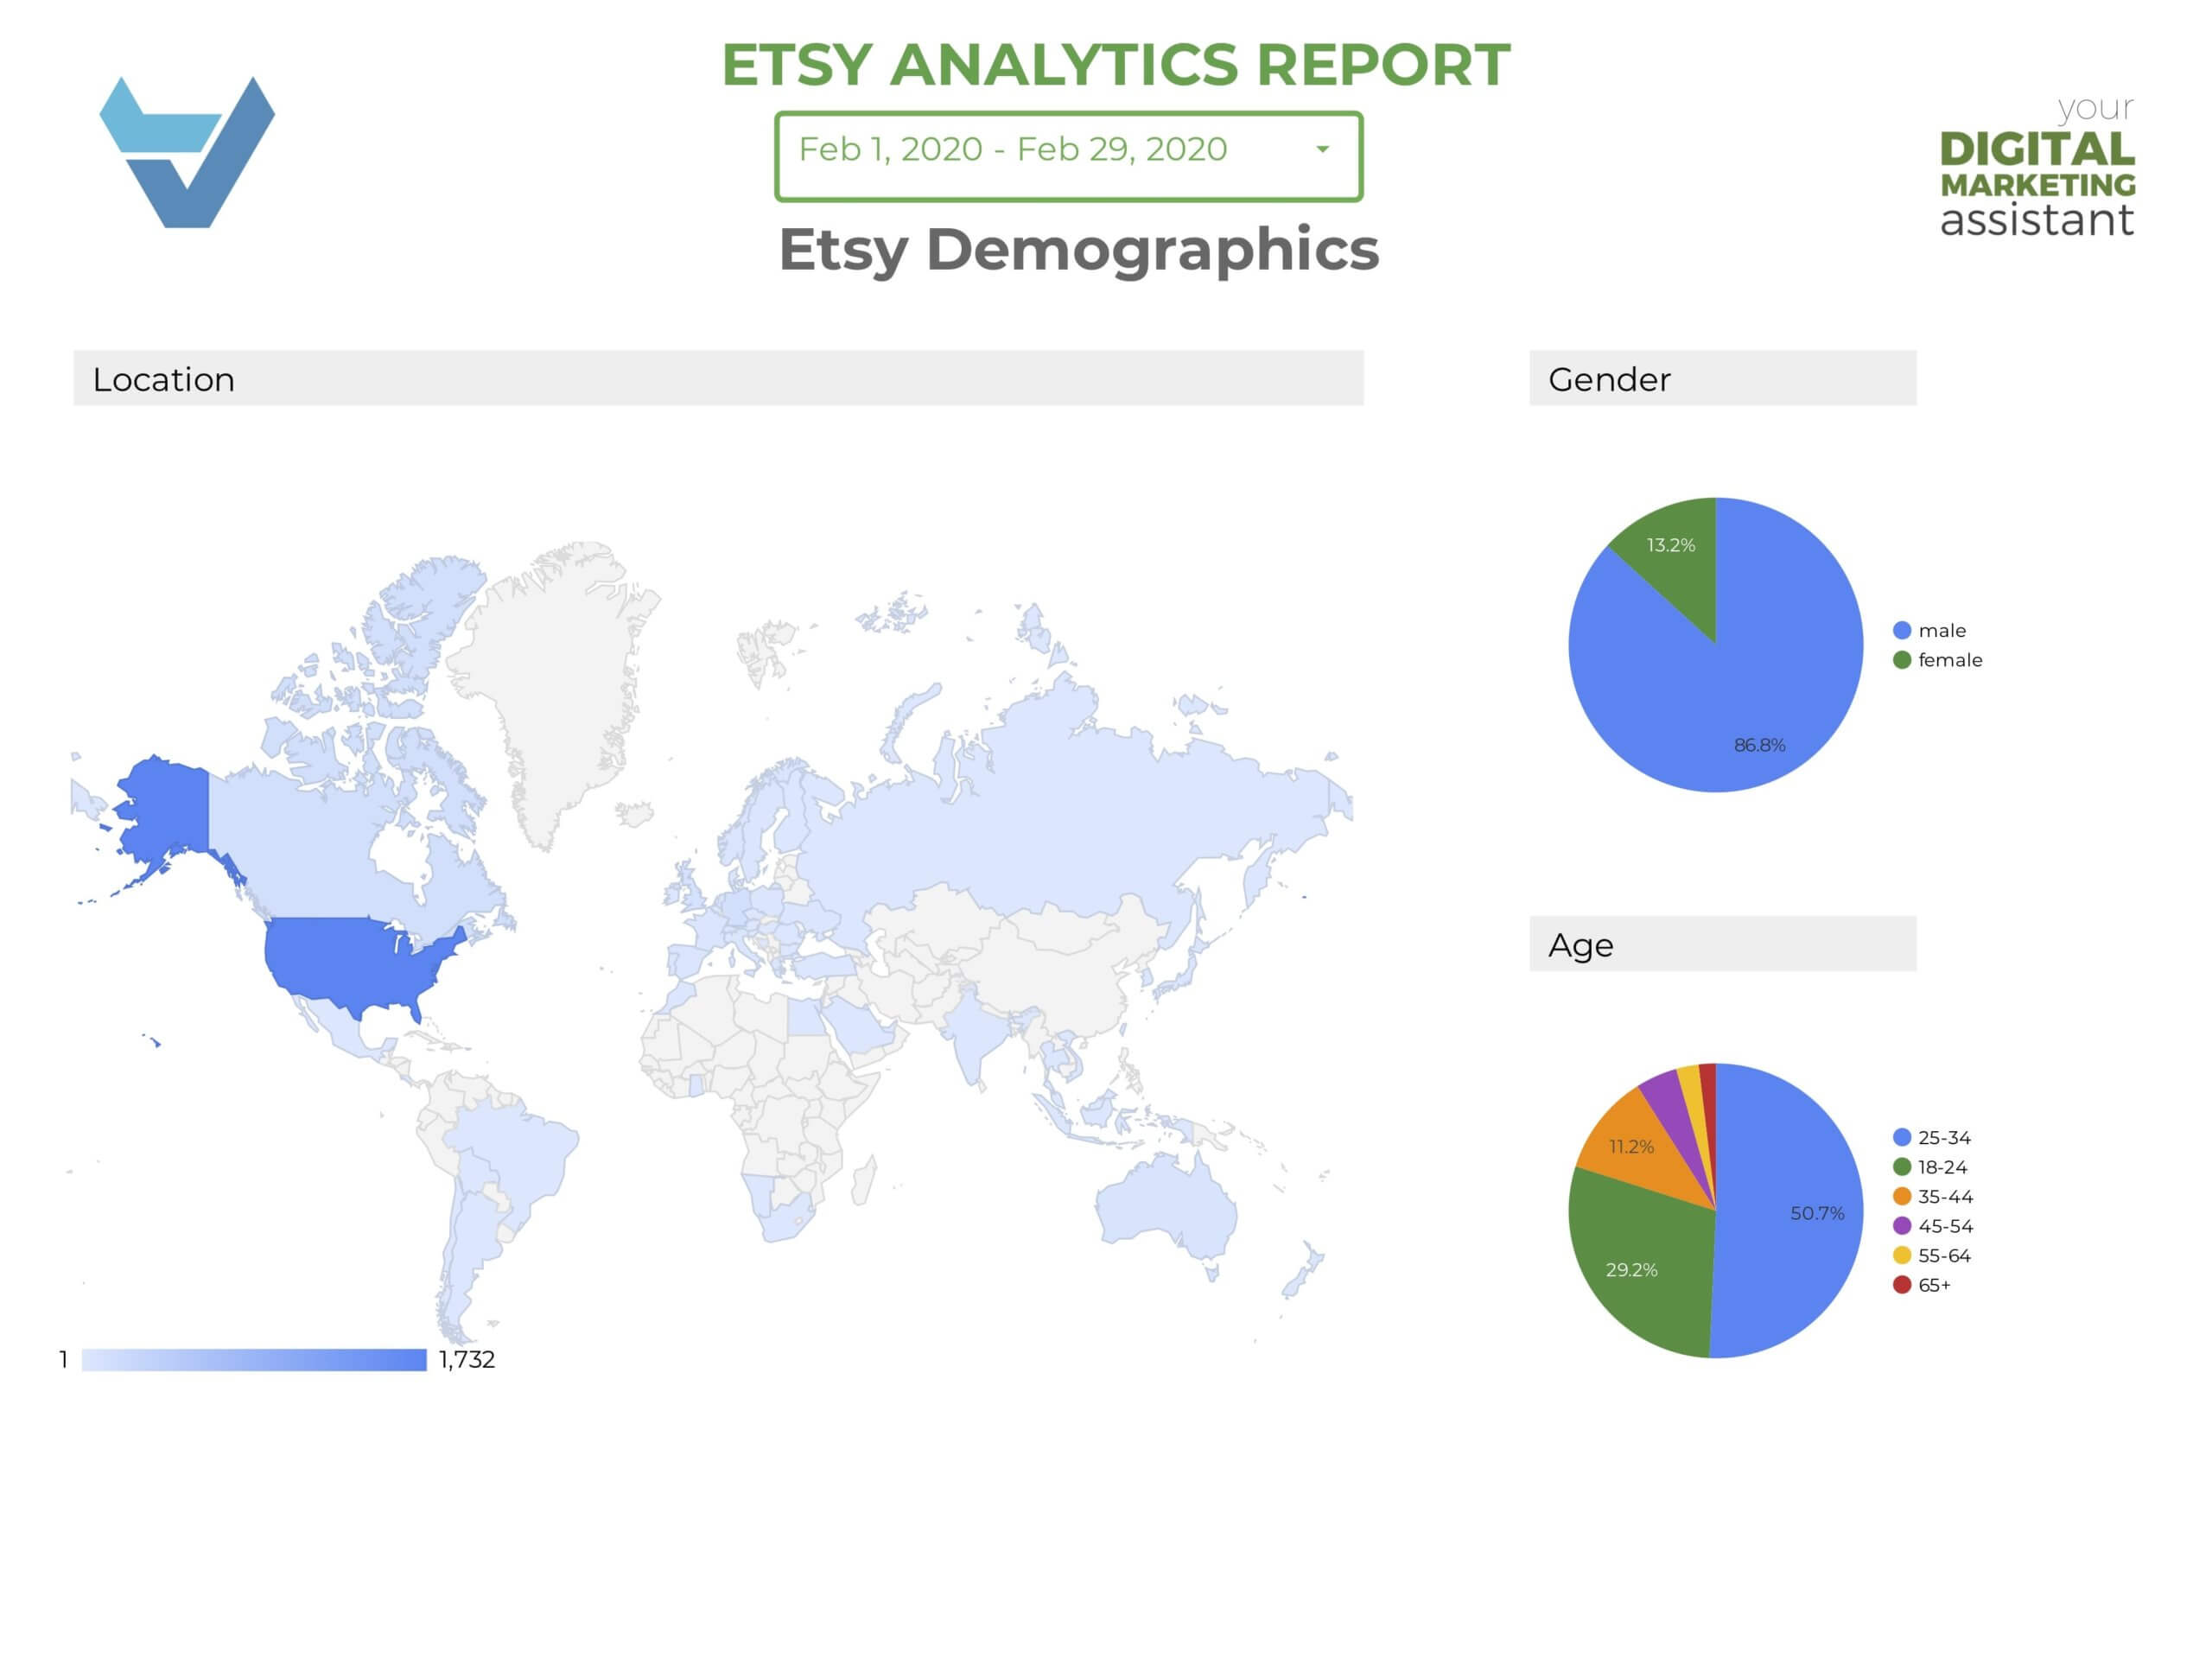
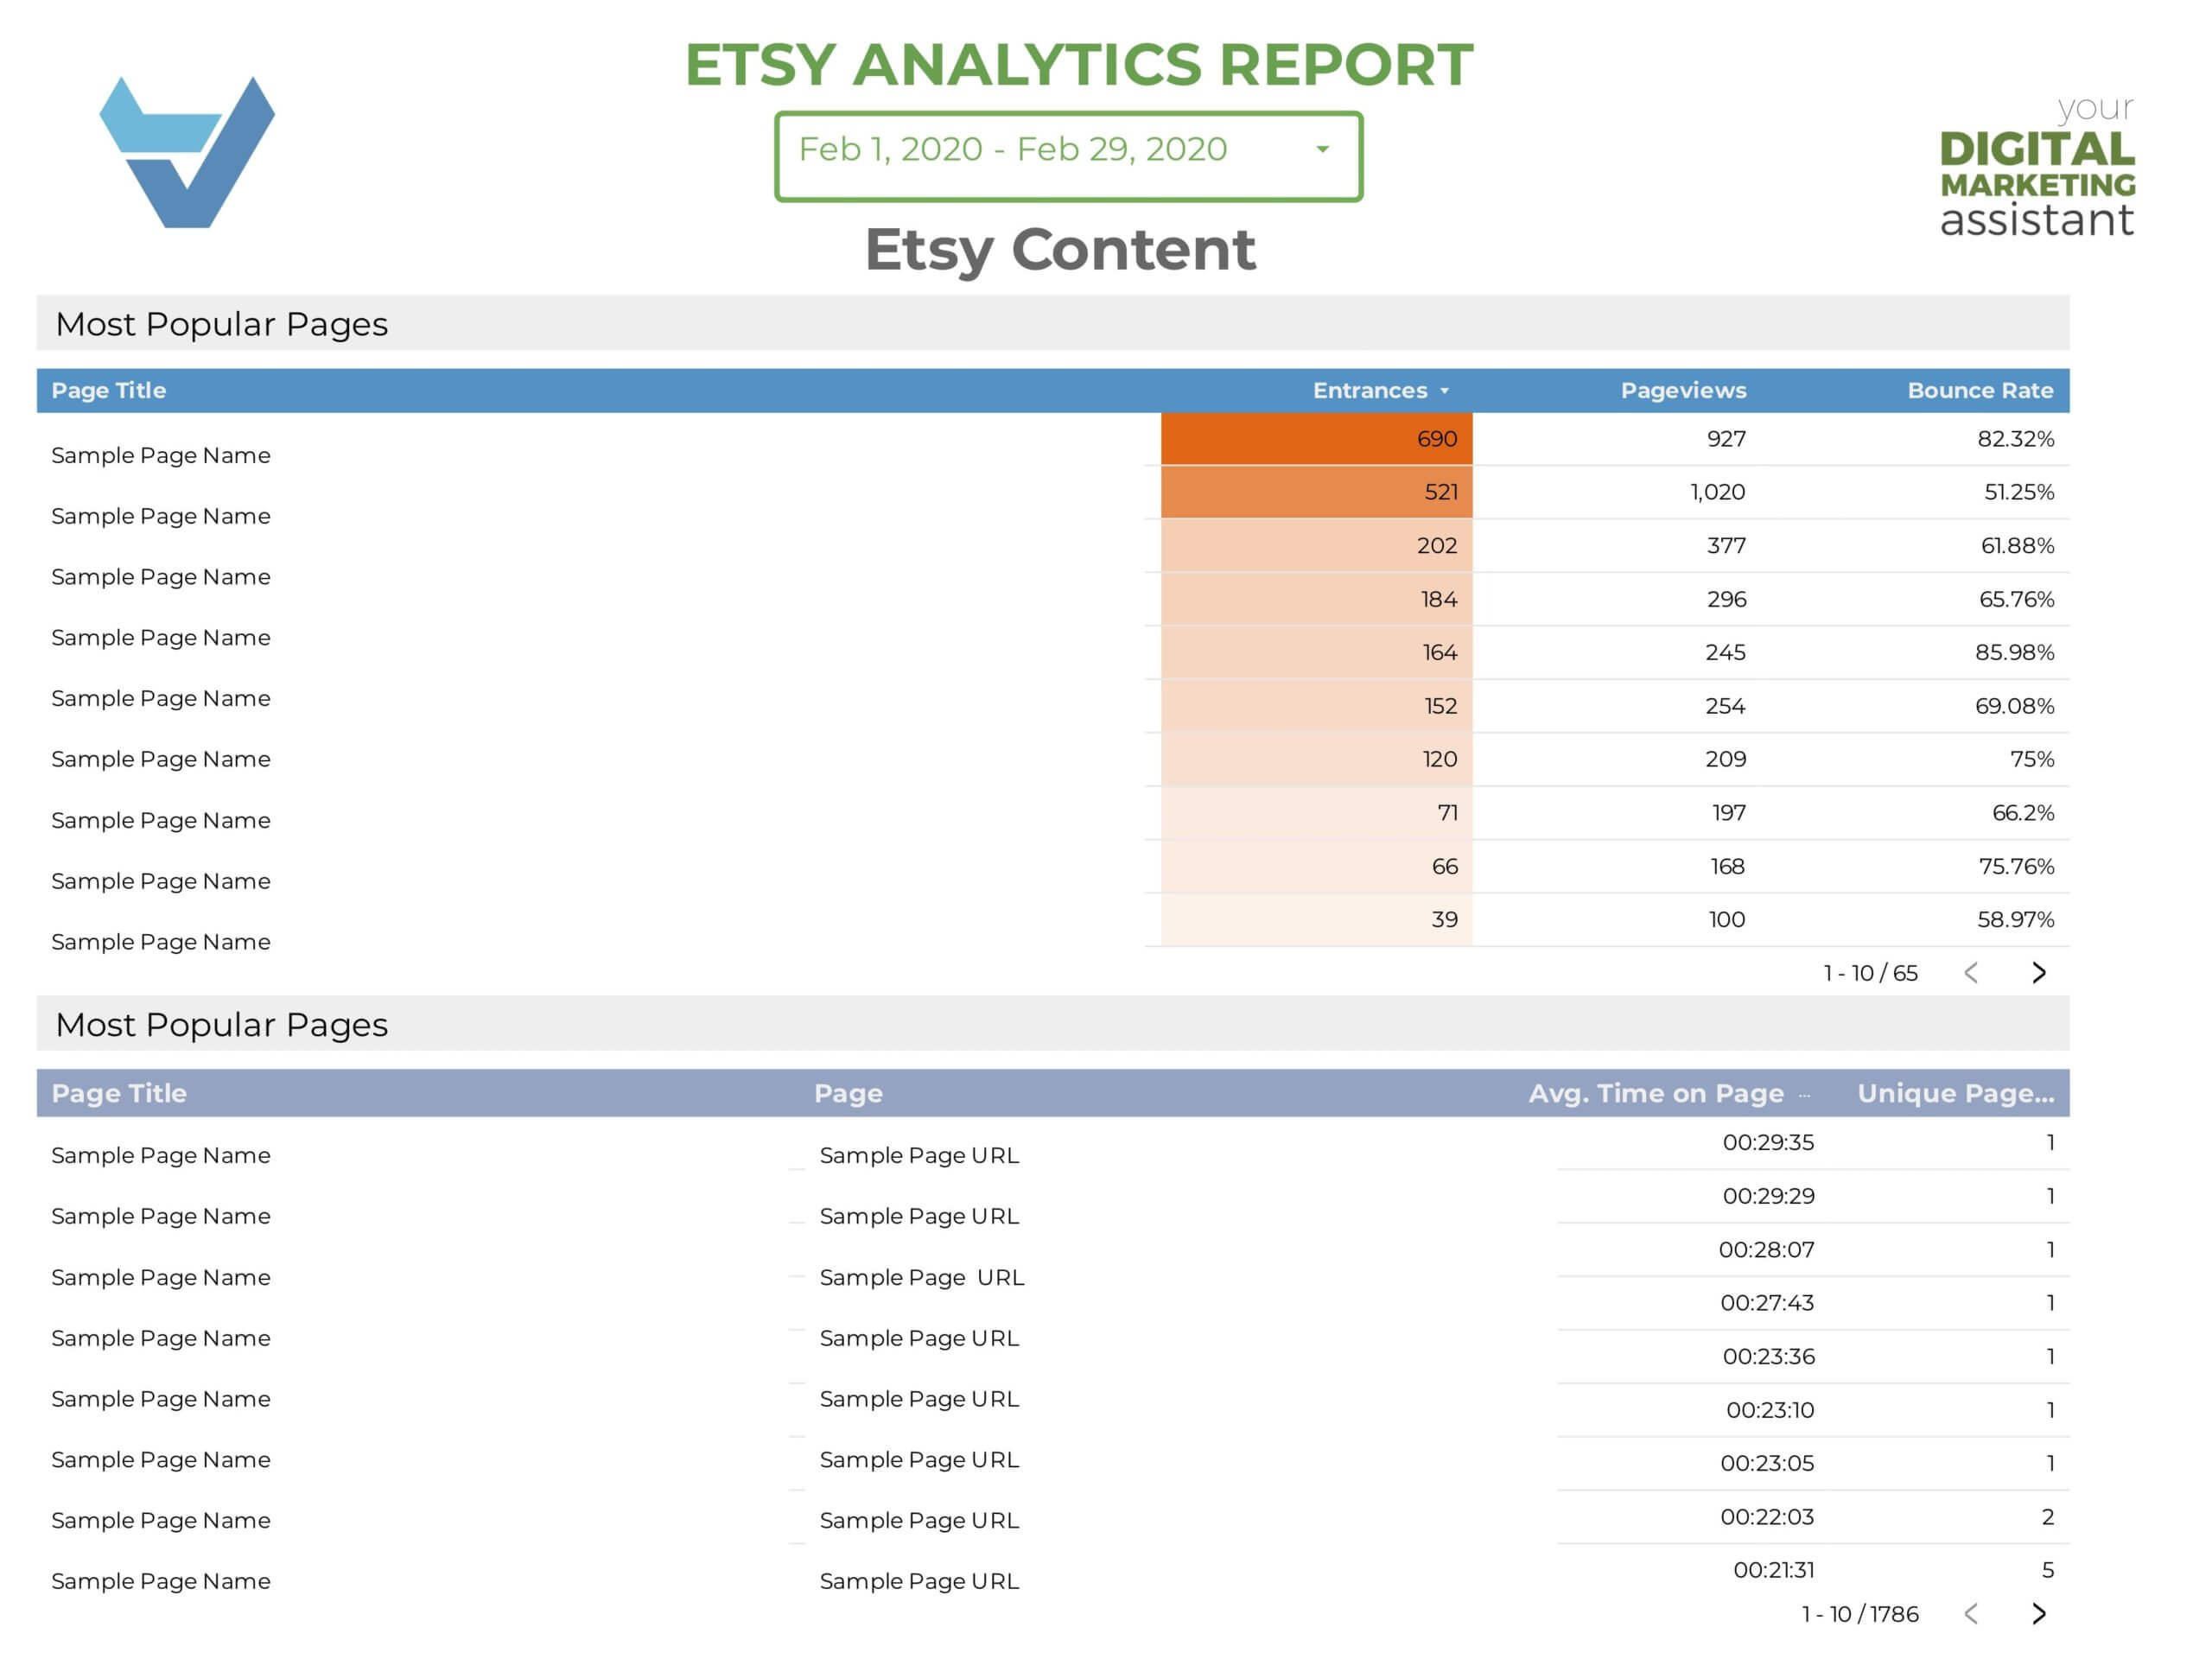
For example, this Etsy report helps my client see how their website is performing against their Etsy shop.
Pricing & Packages
1 Page Campaign Report
See your marketing efforts all at once-
1 page report
-
Custom branding/colors or white labeling
-
4 Connections (like AdWords, Analytics, or Search Console)
-
Up to 5 Tag Manager tags implemented
-
Up to 16 data visualizations like charts, tables, and graphs
-
Live date filters
-
2 additional filters
-
Monthly report sent to your email
Add-Ons
-
Social Media Connection $45/ month
Social media platforms don't supply a data source out of the box. This subscription allows you to connect with one of the following through Supermetrics: Custom JSON/CSV, Facebook Ads, Facebook Insights, Facebook Public Data, Google Ads, Google AdSense, Google Analytics, Google My Business, Google Search Console, LinkedIn Ads, LinkedIn Company Pages, MailChimp, Microsoft Advertising, Moz, Pinterest Public Data, Quora Ads, Reddit Public Data, SEMrush, Stripe, Tumblr, Twitter Ads
Website Report
A deep dive into your search & analytics-
4+ page report
-
Custom branding/colors or white labeling
-
4 Connections (like AdWords, Analytics, or Search Console)
-
Up to 20 Tag Manager tags implemented
-
Up to 30 data visualizations like charts, tables, and graphs
-
Live date filters
-
2 additional filters
-
Monthly report sent to your email
Add-Ons
-
YouTube Reporting $90
Connection to one YouTube channel, plus one page of additional visualizations
-
AdWords Reporting $180
Connection to one account with general reporting, or one campaign with detailed reporting, including 2 pages of additional visualizations
-
Social Media Reporting $90
1 account connection, plus 1 page of visualizations. $45/month subscription is required.
Custom Platform Reporting
Have another platform to measure your success on?
Let me know what platform you’re working with, and if there’s a way to connect it to data studio, we will! I’m happy to come up with a custom quote for you.

I’m happy to work with agencies who need white label solutions for their clients. I offer a discount for multiple projects or a monthly retainer.